4.3. Klister: A First Pass Performance Engineering
This chapter is a case study on a first pass of performance engineering for the klister programming language interpreter. This case study should be exemplary of any system which is shortlived, has distinct phases of input and output, and maintains state. To diagnose the performance issues this case study uses Heap Profiling with Eventlog, Info Table Profiling, TickyTicky profiling. The optimizations are trivial: choosing better data structures and closing memory leaks; any intermediate level Haskeller should be able to follow along. After reading this chapter, a reader should be able to spot inefficient data structure use by reading code, and GHC’s profiling tools to diagnose memory performance issues and identify hot code. To read through the code, this commit is the result of the case study, and this commit was the state of the klister code base that the tutorial starts with.
The rest of the chapter is structured as follows. We introduce the klister interpreter and perform a performance minded code review. We then use the klister testsuite to identify a poor performing program. Using this program we begin performance engineering by: identifying a problem, implementing a change, testing that the change was effective, and then repeating the process having either made progress or by changing another part of the interpreter.
4.3.1. Introduction to the System
The system we are analyzing is the interpreter for klister. Klister is an interpreted scheme-like programming language. The exact kind of language is not particularly relevant, but one can expect it to have typical scheme features such as s-expression syntax, hygenic macros and lexical scoping. All we need to know about that the klister interpreter inputs a program, parses the program, maintains mutable stores of variables and outputs a result.
To begin performance engineering we’ll review the subsystems that compose the interpreter. In klister, there are 4 major subsystem:
Parser: The system that lexes and tokenizes. Klister employs MegaParsec for its parser.
Expander: klister is a scheme-like language with hygenic macros. This subsystem performs the macro expansion and elaboration typical to these kinds of programming languages.
Type Checker: klister is a pure functional language with Hindley-Milner type checking and higher-ordered types, including type safe macros. This subsystem type checks klister code.
Evaluator: The evaluator inputs an abstract syntax tree which represents a klister program, executes program in the Haskell runtime system and outputs the result.
4.3.2. Characterizing the Problem
Our goal is to speed up the klister interpreter, but this goal is too vague and is not actionable. We first need to be able to make statements that are precise enough to be actionable. That is, we need to have a reproducible test to observe where time is spent, and, where and how much memory is allocated and consumed. Then we can correlate these costs to particular subsystems in the interpreter. For example, we wish to be able to say “The parser finishes a 100 line program in 100ms and runs in 100Kb of constant space, but the expander allocates 2Gb and finishes its computation in 2 minutes!”. Once we can make precise statements, we can begin forming hypotheses to speed up the system.
We’ll use klister’s testsuite to find a reproducible test. The testsuite provides good sample of programs and will allow us to find a degenerate program. With a degenerate program, we’ll record and correlate runtime costs to each subsystem and find the offending piece of source code.
Note
A quick note on these degenerate programs and a mental model that you might
find useful. In the abstract, we can think about the system space of the
system. The system space is the space of all possible semantically equivalent
systems, for some input and for some available resources. For example, for
klister, given the input program (+ 2 2) we have an infinite space of
possible klister interpreters, some with many machine resources and some with
few. Similarly, given the same machine to run the klister interpreter, and
the same input program, we still have an infinite space of klister
interpreters, some of which will be very fast (in wall time) and some will be
very slow, depending on their implementation.
Now we can imagine that there are boundaries [1] in this system space that delineate acceptable performance from unacceptable performance, however one defines performance and what is acceptable. These degenerate programs are inputs that point to such a boundary, and thus they are useful allies in our performance work. As we improve the interpreter these boundaries will change, the space of acceptability will grow and we’ll have to find even more degenerate programs to observe the boundaries again.
4.3.3. Performance Minded Code Review
Before running the testsuite, we’ll begin with a code review to better understand the interpreter and to read through the code with a performance engineering mindset. Here is a list of things that are noticeable from reading through the source code.
Lazy
Data.Mapin the interpreter state.Lazy
modifyIORefin the interpreter state.Use of lazy tuples throughout the code base.
Lists used as general purpose containers.
Lazy State Monad especially in the Expander.
Lazy WriterT monad transformer in the Expander.
Use of Monad Transformers and ExceptT in the interpreter state.
Lack of Specialization, especially in
IORefutilities module and in lens driven code.Some modules do not use explicit exports.
No use of
-funbox-strict-fieldsfor bang patterns orUNPACKpragmas.Using
foldron a list (seeExpander.getExports) even though the code does not exploit laziness.Using
Integerinstead ofInt.
We won’t being going through each in detail, but instead just highlight a few
consequential items. Note that not all of these need to be fixed or are
categorically a mistake. It depends on what the system is trying to do and how
the implementation is trying to realize the system. For example, there might be
a perfectly good reason to use an Integer over an Int, such as one
expects to handle data past the Int range.
4.3.3.1. Data.Map With Expensive Keys
The ExpanderState is a key type in the klister interpreter. It is stored in
an IORef and maintains state for the expander. From a performance
perspective the ExpanderState is suspect because it employs data structures
that are lazy and yet the interpreter will eventually use everything in the
state. Here is the definition of the ExpanderState:
 data ExpanderState = ExpanderState
{ _expanderWorld :: !(World Value)
, _expanderNextScopeNum :: !Int
, _expanderGlobalBindingTable :: !BindingTable
, _expanderExpansionEnv :: !ExpansionEnv
, _expanderTasks :: [(TaskID, ExpanderLocal, ExpanderTask)]
, _expanderOriginLocations :: !(Map.Map SplitCorePtr SrcLoc)
, _expanderCompletedCore :: !(Map.Map SplitCorePtr (CoreF TypePatternPtr PatternPtr SplitCorePtr))
, _expanderCompletedPatterns :: !(Map.Map PatternPtr (ConstructorPatternF PatternPtr))
, _expanderCompletedTypePatterns :: !(Map.Map TypePatternPtr TypePattern)
, _expanderPatternBinders :: !(Map.Map PatternPtr (Either [PatternPtr] (Scope, Ident, Var, SchemePtr)))
, _expanderTypePatternBinders :: !(Map.Map TypePatternPtr [(Scope, Ident, Var, SchemePtr)])
, _expanderCompletedTypes :: !(Map.Map SplitTypePtr (TyF SplitTypePtr))
, _expanderCompletedDeclTrees :: !(Map.Map DeclTreePtr (DeclTreeF DeclPtr DeclTreePtr))
, _expanderCompletedDecls :: !(Map.Map DeclPtr (Decl SplitTypePtr SchemePtr DeclTreePtr SplitCorePtr))
, _expanderModuleTop :: !(Maybe DeclTreePtr)
, _expanderModuleImports :: !Imports
, _expanderModuleExports :: !Exports
, _expanderPhaseRoots :: !(Map Phase Scope)
, _expanderModuleRoots :: !(Map ModuleName Scope)
, _expanderKernelBindings :: !BindingTable
, _expanderKernelExports :: !Exports
, _expanderKernelDatatypes :: !(Map Datatype DatatypeInfo)
, _expanderKernelConstructors :: !(Map Constructor (ConstructorInfo Ty))
, _expanderKernelValues :: !(Env Var (SchemePtr, Value))
, _expanderDeclOutputScopes :: !(Map DeclOutputScopesPtr ScopeSet)
, _expanderCurrentEnvs :: !(Map Phase (Env Var Value))
, _expanderCurrentTransformerEnvs :: !(Map Phase (Env MacroVar Value))
, _expanderCurrentDatatypes :: !(Map Phase (Map Datatype DatatypeInfo))
, _expanderCurrentConstructors :: !(Map Phase (Map Constructor (ConstructorInfo Ty)))
, _expanderCurrentBindingTable :: !BindingTable
, _expanderExpressionTypes :: !(Map SplitCorePtr Ty)
, _expanderCompletedSchemes :: !(Map SchemePtr (Scheme Ty))
, _expanderTypeStore :: !(TypeStore Ty)
, _expanderKindStore :: !KindStore
, _expanderDefTypes :: !(TypeContext Var SchemePtr) -- ^ Module-level definitions
}
These Maps are suspicious because every type suffixed with Ptr is a
newtype over an Integer. For example, SplitCorePtr is an newtype over a
Unique which is itself a newtype over Integer:
newtype SplitCorePtr = SplitCorePtr Unique
  deriving (Eq, Ord)
newtype Unique = Unique Integer
  deriving (Data, Eq, Ord)
This means that klister has a lot of Maps effectively indexed on
Integer. Clearly an IntMap would be a better choice of data structure.
An IntMap has several advantages over Data.Map. Data.Map is an
implementation of size balanced binary trees (see the hackage
docs). These trees require re-balancing in order to maintain the balanced
invariant. This balancing slows down writes (that is, adds work to
Data.Map.insert) and consequently merges, because a merge of any two trees
may invoke a re-balancing. In contrast, IntMap is a big-endian PATRICIA Trie
(see Okasaki [1]) which never require balancing. Compared to Data.Map,
an IntMap provides faster writes at the cost of slightly slower reads.
Additionally, IntMap uses less total memory than Data.Map [2].
The klister interpreter also uses Map’s indexed over String like types.
For example, _expanderKernelDatatypes is a Map Datatype DatatypeInfo,
where DataType is a record:
data Datatype
  = Datatype
    { _datatypeModule :: !ModuleName -- ^ The module that defines the datatype
    , _datatypeName :: !DatatypeName -- ^ The unique name for the datatype at this module and phase
    }
  deriving (Data, Eq, Ord, Show)
where ModuleName and DatatypeName are a String and Text
respectively:
data ModuleName = ModuleName FilePath | KernelName KernelName
  deriving (Data, Eq, Ord, Show)

newtype DatatypeName = DatatypeName { _datatypeNameText :: Text }
  deriving newtype (Eq, IsString, Ord, Show, Hashable)
  deriving stock Data
Indexing over Data.Map over String like types is a performance
anti-pattern. In the worse case, the Ord and Eq instance on String
will need to check the entire String. Even in the average case, the extra
comparisons will be required in order to rebalance the tree, which will slow
down writes and merges.
A better datastructure for maps indexed over String like types is
Data.HashMap from the unordered-containers library. These maps are
Hashed Array Mapped Trie’s, or HAMTs for short (see Bagwell [6]).
HAMTs index over a hash that uniquely represents the key. These data
structures are efficient for any key type where equality could be expensive;
such as String, Text or inductive data types that derive Eq.
4.3.3.2. Lazy Tuples
Consider this field of the ExpanderState:
...
, _expanderTypePatternBinders :: !(Map.Map TypePatternPtr [(Scope, Ident, Var, SchemePtr)])
...
The elements of this map is a list of 4-tuples. This list will have an excessive amount of indirection to its values. Not only will the interpreter be chasing pointers in the elements of the list but it’ll have to chase pointers for each element of the tuple. This will be slow if these lists ever become large (over ~30 elements) and if this list will be the subject of folds. For this specific datatype, there is one fold in the klister interpreter:
else do
  varInfo <- view (expanderTypePatternBinders . at patPtr) <$> getState
  case varInfo of
    Nothing -> throwError $ InternalError "Type pattern info not added"
    Just vars -> do
      p <- currentPhase
      let rhs' = foldr (addScope p) stx
                   [ sc'
                   | (sc', _, _, _) <- vars
                   ]
      withLocalVarTypes
        [ (var, varStx, t)
        | (_sc, varStx, var, t) <- vars
        ] $
        expandOneExpression ty dest rhs'
The code projects expanderTypePatternBinders and looks up the list that
patPtr points to. It then iterates over that same list twice: First, to
project the sc' from the first position and pass it to addScope. Second,
to project the second, third and fourth positions into a list of 3-tuples and
pass that to withLocalVarTypes. This code can be improved with Loop
Fusion to iterate over the list once, using foldl' instead of foldr,
and by defining a datatype which unpacks every field instead of using (,,,)
to avoid the extra allocation for these tuples. Note that defining a such a
datatype will require that \(\bot\) is never an element of the 4-tuple. In this
case that will be true, but it is not true in general; again, in order to
optimize you must understand the system.
Generally types such as (,,,) are a path of least resistance when writing
new code. They are easy to reach for, easy to write and don’t require more
domain modeling. However, tuples, and especially tuples with more than two
fields, are a consistent source of memory leaks. So one is almost always better
off defining a datatype instead of using a tuple for performance.
Note
Of course, you may not want to add yet another datatype to the implementation. One may want the datatypes in the implementation to map cleanly to domain objects. This a classic tradeoff between performance, readability and maintainability.
4.3.3.3. Running the testsuite
Klister does not have a benchmark suite, but does have a testsuite (with 124 tests) written in tasty which outputs the wall time of each test. So let’s run the testsuite to find a degenerate test:
$ cabal test --test-show-details=streaming  --ghc-options='-O2'

  Test suite klister-tests: RUNNING...
  All tests
    Expander tests
      ...
      Module tests
        Expected to succeed
          ...
          examples/lang.kl:                              OK (0.04s)
          examples/import.kl:                            OK (0.02s)
          examples/macro-body-shift.kl:                  OK (0.03s)
          examples/test-quasiquote.kl:                   OK (0.05s)
          examples/quasiquote-syntax-test.kl:            OK (0.04s)
          examples/hygiene.kl:                           OK (0.84s)
          examples/defun-test.kl:                        OK (0.01s)
          examples/fun-exports-test.kl:                  OK (0.04s)
    Golden tests
      test-quasiquote:                                   OK (0.03s)
      io:                                                OK (0.03s)
      defun-test:                                        OK (0.04s)
      contract:                                          OK (0.11s)
      int-ops:                                           OK (0.03s)
      implicit-conversion:                               OK (7.02s)
      ...
      implicit-conversion-test:                          OK (9.89s)
      higher-kinded-patterns:                            OK (1.80s)
      custom-literals-test:                              OK (0.46s)
      double-define:                                     OK (0.34s)
      custom-module-test:                                OK (0.55s)
      which-problem:                                     OK (0.82s)
      incorrect-context:                                 OK (0.03s)
      bound-vs-free:                                     OK (0.31s)
      meta-macro:                                        OK (0.11s)
      integer-syntax:                                    OK (0.04s)
      import:                                            OK (0.04s)

      All 124 tests passed (38.15s)
      Test suite klister-tests: PASS
The entire testsuite finishes in 38 seconds. Notice that both
implicit-conversion and implicit-conversion-test are extreme outliers,
passing in 7 and 9 seconds, whereas each other test passes in well under a
second (except higher-kinded-patterns). We have found our degenerate
program.
4.3.4. Restate the Problem
For the rest of the case study we’ll focus on speeding up
implicit-conversion-test under the assumption that our changes will also
speed up the other tests and consequently the entire interpreter. It is
certainly possible that optimizations in one subsystem of your code base will
not translate to better overall performance. We make this assumption because
this is the first pass of performance engineering for this code. So the
probability that our changes do impact overall performance is high.
We have identified a list of likely issues, but before we begin to change things
we need to make sure that the problems we’ve identified are indeed problems. Or
in other words, we should only make changes once we have evidence that the
code we’re changing is problematic. If the maps are a problematic factor then we
should expect a lot of allocations to come from Data.Map.insert, Eq and
Ord instance methods, and the functions Data.Map.Internal.balanceR and
Data.Map.Internal.balanceL. This is a good opportunity to not think
and look with a ticky report.
First we’ll generate a ticky report for the entire testsuite:
$ cabal test --test-show-details=streaming --test-options='+RTS -rticky -RTS' --ghc-options='-rtsopts -ticky -ticky-allocd -ticky-dyn-thunk'
  Build profile: -w ghc-9.2.4 -O1
  ...
and check the results sorted by allocations. As a reminder, there are 5 columns in a ticky report. The first column is entries. The second column is the number of bytes allocated by the code for the closure. The third column is the number of bytes addressed to each closure. The fourth column classifies the closure by type with a shorthand notation, and the last column displays the names of the Stg closure the ticky profile is describing:
$ cat ticky | tail -n +20 | sort -k2 -nr | less

  53739709 4299176720          0   3 +.>                  ScopeSet.$wallScopeSets'{v rNAX} (fun)
  60292448 3858716672 2149588360   3 +..                  sat_sOYl{v} (ScopeSet) (fun) in rNAX
  81547057 1368797696          0   4 SISM                 ScopeSet.$w$sgo4{v rNAW} (fun)
  57730804 1305110352          0   4 SISM                 ScopeSet.$w$sgo1{v rNAV} (fun)
  61143424  841913088          0   2 SM                   ScopeSet.isSubsetOf_go15{v rOUK} (fun)
   7819243  815587232          0   6 >pii.M               Binding.$w$sgo3{v r1syq} (fun)
  17961626  421056776          0   3 >MM                  Binding.$fMonoidBindingTable_$sunionWith{v r1syc} (fun)
    867831  366262720          0  10 piiSiSL>>>           Parser.Common.$wg{v rk} (fun)
    886661  333384536          0   6 SS>>>>               located{v r1b6H} (Parser) (fun)
   4552387  298031744          0   3 ISM                  Expander.$w$sgo4{v r5BKT} (fun)
   4843152  270145008     612288   1 M                    go15{v s1szA} (Binding) (fun) in r1syd
   2699373  259139808          0   4 >SSM                 Syntax.$w$cmapScopes{v rTEZ} (fun)
  18445979  240603872          0   4 piiM                 Binding.$w$sgo1{v r1syi} (fun)
   1351616  237884416     612288   1 T                    f{v s1szf} (Binding) (fun) in r1syd
   1862523  211065056          0   3 S>M                  ScopeSet.$satKeyIdentity_$sgo15{v rOUv} (fun)
   3383994  186416288   43447360   2 LM                   go15{v sP96} (ScopeSet) (fun) in rOUk
    101588  145802400          0   4 MSSM                 $wexpandOneForm{v r5IwM} (Expander) (fun)
   2607448  125157504          0   2 >S                   Syntax.$fHasScopesSyntax_$cmapScopes{v rTEY} (fun)
  ...
There are several interesting aspects to this ticky profile snippet. First, the
most allocating code is ScopeSet.allScopeSets', it is allocating a
dictionary (+) of some type (.) and function (>). Observing a
function call to a dictionary + in a ticky report can often mean that a
function did not specialize. So from this ticky we suspect that
allScopeSets' has not specialized. The second most allocating closure is a
SAT’d function sat_sOYl (see The Static Argument Transformation). From its description: {v} (ScopeSet) (fun) in rNAX, we can see
that it is a non-exported name ({v}) just like allScopeSets', in the
(ScopeSet) module. It is a function (fun) and is a local function in the
rNAX closure. The rNAX closure is the Stg name of the closure for
allScopeSets' as shown in description for allScopeSets'. So the two most
allocating function calls in the interpreter, when running the testsuite, are
due to allScopeSets. Clearly, allScopeSets is a good target for
performance engineering.
We also see that the 5th and 6th most allocating functions called are
ScopeSet.isSubsetOf and Binding.$fMonoidBindingTable_$unionWith. That
suggests peculiar usage pattern; isSubsetOf should only return a Bool
which should not be an allocating function call. unionWith should be
allocating, but that this occurs in the Monoid Binding instance means that
the Binding Monoid instance is heavily allocating. Let’s check these
functions in the source code:
data ScopeSet = ScopeSet
  { _universalScopes :: Set Scope
  , _phaseScopes :: Map Phase (Set Scope)
  }


data Scope = Scope { scopeNum :: Int, scopePurpose :: Text }
  deriving (Data, Eq, Ord, Show)

newtype Phase = Phase { phaseNum :: Natural }
  deriving (Data, Eq, Ord, Show)

isSubsetOf :: Phase -> ScopeSet -> ScopeSet -> Bool
isSubsetOf p scs1 scs2 =
  Set.isSubsetOf (scopes p scs1) (scopes p scs2)


scopes :: Phase -> ScopeSet -> Set Scope
scopes p scs = view universalScopes scs `Set.union`
               view (phaseScopes . at p . non Set.empty) scs
ScopeSet is a record of Data.Set Scope and Data.Map indexed by
Phase that holds Set Scope. Furthermore, both Scope and Phase
are Integer-like. So we have an implementation that could use IntMap and
IntSet instead of Data.Map and Data.Set.
We know that isSubsetOf does a lot of allocation. Now we can see where this
allocation is happening. isSubsetOf checks that scs1 is a subset of
scs2 by calling Set.isSubsetOf on the result of the scopes function.
scopes is allocating a new Set Scope from the ScopeSet via
Set.union, then using the results of a lookup on the phaseScopes Map,
then merging two Set’s just to check the subset.
There are several ways to improve the memory performance of this function.
First, we can employ better data structures. We know that this code is
performing a lot of merges, so we should expect an improvement in both time and
memory performance by using an IntMap and IntSet because these data
structures provide more efficient merges than Data.Set and Data.Map.
Second, we can use a better algorithm. From the ticky, isSubSetOf was called
61143424 times. As written, this code will perform its lookups and unions each
time, even if we have a duplicate call. So this seems to be a good candidate for
memoization or caching the calls to isSubsetOf. We could also avoid building
the intermediate Set in the scopes function by checking for a subset
without merging universalScopes and phaseScopes.
The second interesting function was unionWith in the Monoid Binding
instance. Here is the source code:
newtype BindingTable = BindingTable { _bindings :: Map Text [(ScopeSet, Binding, BindingInfo SrcLoc)] }
  deriving (Data, Show)

instance Semigroup BindingTable where
  b1 <> b2 = BindingTable $ Map.unionWith (<>) (view bindings b1) (view bindings b2)

instance Monoid BindingTable where
  mempty = BindingTable Map.empty
A BindingTable is a Map keyed on Text that holds a list of triples.
The Semigroup instance is the origin of the unionWith in the ticky
profile because Monoid.mappend defaults to the Semigroup definition. This
type is likely too lazy. Data.Map keyed on Text relies on the Ord
and Eq instances of Text for most of its operations. In the worst case
this means the runtime system has to compare the entire Text key, which
could be slow when the Text is large. Another problem is the use of a list.
A list is only an appropriate data structure if it is used like a stack or if it
is used as a store that is eventually traversed and consumed. Once one finds
themselves performing lookups or merges on a list, it is time to use a different
data structure. The last problem is the 3-tuple which we have already covered
above.
To improve the performance of the BindingTable we’ll use a HashMap. This
should yield better merge performance, and faster writes and reads. However,
this may not fix the root cause of the allocations. So we’ll rerun the ticky
report after making the changes to test that we have indeed addressed the
problem.
4.3.5. Optimization 1: Better Data Structures: Maps
We’ve removed all uses of Data.Map and replaced them with either a
HashMap or an IntMap. After the changes ExpanderState now looks
like:
data ExpanderState = ExpanderState
{ _expanderWorld              :: !(World Value)
, _expanderNextScopeNum       :: !Int
, _expanderGlobalBindingTable :: !BindingTable
, _expanderExpansionEnv       :: !ExpansionEnv
, _expanderTasks              :: [(TaskID, ExpanderLocal, ExpanderTask)]
, _expanderOriginLocations    :: !(Store SplitCorePtr SrcLoc)
, _expanderCompletedCore      :: !(Store SplitCorePtr (CoreF TypePatternPtr PatternPtr SplitCorePtr))
, _expanderCompletedPatterns  :: !(Store PatternPtr (ConstructorPatternF PatternPtr))
, _expanderCompletedTypePatterns :: !(Store TypePatternPtr TypePattern)
, _expanderPatternBinders     :: !(Store PatternPtr (Either [PatternPtr] (Scope, Ident, Var, SchemePtr)))
, _expanderTypePatternBinders :: !(Store TypePatternPtr [(Scope, Ident, Var, SchemePtr)])
, _expanderCompletedTypes     :: !(Store SplitTypePtr (TyF SplitTypePtr))
, _expanderCompletedDeclTrees :: !(Store DeclTreePtr (DeclTreeF DeclPtr DeclTreePtr))
, _expanderCompletedDecls     :: !(Store DeclPtr (Decl SplitTypePtr SchemePtr DeclTreePtr SplitCorePtr))
, _expanderModuleTop          :: !(Maybe DeclTreePtr)
, _expanderModuleImports      :: !Imports
, _expanderModuleExports      :: !Exports
, _expanderPhaseRoots         :: !(Store Phase Scope)
, _expanderModuleRoots        :: !(HashMap ModuleName Scope)
, _expanderKernelBindings     :: !BindingTable
, _expanderKernelExports      :: !Exports
, _expanderKernelDatatypes    :: !(HashMap Datatype DatatypeInfo)
, _expanderKernelConstructors :: !(HashMap Constructor (ConstructorInfo Ty))
, _expanderKernelValues       :: !(Env Var (SchemePtr, Value))
, _expanderDeclOutputScopes   :: !(Store DeclOutputScopesPtr ScopeSet)
, _expanderCurrentEnvs        :: !(Store Phase (Env Var Value))
, _expanderCurrentTransformerEnvs :: !(Store Phase (Env MacroVar Value))
, _expanderCurrentDatatypes   :: !(Store Phase (HashMap Datatype DatatypeInfo))
, _expanderCurrentConstructors :: !(Store Phase (HashMap Constructor (ConstructorInfo Ty)))
, _expanderCurrentBindingTable :: !BindingTable
, _expanderExpressionTypes    :: !(Store SplitCorePtr Ty)
, _expanderCompletedSchemes   :: !(Store SchemePtr (Scheme Ty))
, _expanderTypeStore          :: !(TypeStore Ty)
, _expanderKindStore          :: !KindStore
, _expanderDefTypes           :: !(TypeContext Var SchemePtr) -- ^ Module-level definitions
}
where a Store k v is newtype over an IntMap with some type level
handling for keys:
-- new module Util.Store
newtype Store p v = Store { unStore :: IntMap v}
  deriving newtype (Eq, Ord, Show, Semigroup, Monoid, Functor, Foldable)
  deriving stock   Data
type role Store representational _

-- | Tiny module to wrap operations for IntMaps

module Util.Key
  (HasKey(..)
  ) where

class HasKey a where
  getKey :: a -> Int
  fromKey :: Int -> a
The HasKey class is crucial for preserving type safety so that we do not
accidentally merge a Store k v and a Store p v when p is not equal
to k. It also allows us to provide functions such as mapKeys with a
polymorphic type on the Key, as opposed to the monomorphic type in
Data.IntMap:
mapKeys :: HasKey p => (p -> p) -> Store p v -> Store p v
mapKeys f s = Store $! IM.mapKeys (getKey . f . fromKey) (unStore s)
Note
I’ve purposefully taken the opportunity to create the abstraction boundary
Store p v, which is unnecessary from a performance perspective. But by
having an abstraction boundary the system becomes easier to change. For
example, we can now alter the implementation of Store p v without a lot
of code churn occurring in the interpreter. The key point is that if a
subsystem is easy to change, then it is also easy to experiment and engineer,
because the cost of experimentation is reduced. So while performance and
modularity are often in tension, in this case, modularity enables easier and
cheaper (in terms of engineering time) performance engineering.
now let’s check the ticky:
$ cat ticky | tail -n +20 | sort -k2 -nr | less

  53996388 4319711040          0   3 +.>                  ScopeSet.$wallScopeSets'{v rP2F} (fun)
  60490404 3871385856 2159855520   3 +..                  sat_sQ5D{v} (ScopeSet) (fun) in rP2F
  20257037 1487236040          0   3 iMM                  Binding.$wgo{v r1ric} (fun)
  81547057 1368797696          0   4 SISM                 ScopeSet.$w$sgo4{v rP2E} (fun)
  57730804 1305110352          0   4 SISM                 ScopeSet.$w$sgo1{v rP2D} (fun)
    867831  366262720          0  10 piiSiSL>>>           Parser.Common.$wg{v r3zJ} (fun)
    886661  333384536          0   6 SS>>>>               located{v r1art} (Parser) (fun)
  10521949  330656896          0   3 Lii                  ModuleName.$wgo1{v roEi} (fun)
   4552387  298031744          0   3 ISM                  Expander.$w$sgo4{v r5On7} (fun)
   2699373  259139808          0   4 >SSM                 Syntax.$w$cmapScopes{v rUeh} (fun)
   1351616  237884416     612288   1 T                    f{v s1sRr} (Binding) (fun) in r1rif
   3159635  193376496    1071504   1 M                    go{v s1sS8} (Binding) (fun) in r1rif
   2348710  169685264    1156288   1 M                    go2{v s16Wz} (Env) (fun) in r16zL
   4590545  146897440  183644160   0                      f2{v s1t5Z} (Binding) (thk) in r1ric
    101588  145802400          0   4 MSSM                 $wexpandOneForm{v r5VBM} (Expander) (fun)
   2607448  125157504          0   2 >S                   Syntax.$fHasScopesSyntax_$cmapScopes{v rUeg} (fun)
   1357729  119480152     486976   1 S                    sat_s5YKN{v} (Expander) (fun) in s5YKB
    144974  118076280          0  10 piiiSL>>>>           $wm2{v r1arF} (Parser) (fun)
Notice that the entries to unionWith and isSubsetOf have disappeared.
isSubsetOf is still in the ticky report but is now shown as non-allocating:
...
38279681          0          0   2 MM                   ScopeSet.$sisSubsetOf_$sisSubsetOfX{v rP2u} (fun)
...
Which is strange. We should expect it to be allocating, although allocating a
lot less. We are likely observing some new optimization GHC is applying. In any
case, its a good sign. We’ve demonstrated progress with the ticky report. Now
let’s verify that these changes propagate to the implicit-conversion test.
Test suite klister-tests: RUNNING...
All tests
  Expander tests
  ...
    Module tests
      Expected to succeed
      ...
        examples/lang.kl:                              OK (0.04s)
        examples/import.kl:                            OK (0.03s)
        examples/macro-body-shift.kl:                  OK (0.04s)
        examples/test-quasiquote.kl:                   OK (0.04s)
        examples/quasiquote-syntax-test.kl:            OK (0.03s)
        examples/hygiene.kl:                           OK (0.66s)
        examples/defun-test.kl:                        OK (0.03s)
        examples/fun-exports-test.kl:                  OK (0.04s)
  Golden tests
    test-quasiquote:                                   OK (0.04s)
    io:                                                OK (0.03s)
    defun-test:                                        OK (0.03s)
    contract:                                          OK (0.08s)
    int-ops:                                           OK (0.05s)
    implicit-conversion:                               OK (10.42s)
    ...
    implicit-conversion-test:                          OK (13.55s)
    higher-kinded-patterns:                            OK (0.77s)
    custom-literals-test:                              OK (0.38s)
    double-define:                                     OK (0.28s)
    custom-module-test:                                OK (0.33s)
    which-problem:                                     OK (0.53s)
    incorrect-context:                                 OK (0.03s)
    bound-vs-free:                                     OK (0.25s)
    meta-macro:                                        OK (0.10s)
    integer-syntax:                                    OK (0.04s)
    import:                                            OK (0.03s)
Performance has degraded even though the ticky report showed an improvement!
That we do not observe any difference in wall time after fixing the 5th and
6th most allocating function calls is contrary to what we should expect; even if
the total allocations of these functions are one order of magnitude less than
allScopeSets. The Data.Map performance costs must have been eclipsed by
some other issue. Let’s generate a heap profile to see what’s going on in the
heap.
4.3.6. Optimization 2: A Memory Leak Casts a Long Shadow
To continue engineering the interpreter we need to be able to observe the
effects of any change we make. Unfortunately, the memory leak we discovered in
the last section was so large it eclipsed the effect of our changes. Clearly we
need to fix this leak in order to continue to optimize. To tackle this memory
leak, we’ll use eventlog and eventlog2html to observe the heap only on
implicit-conversion-test. To begin we’ll inspect the types that were
allocated on the heap by passing -hy:
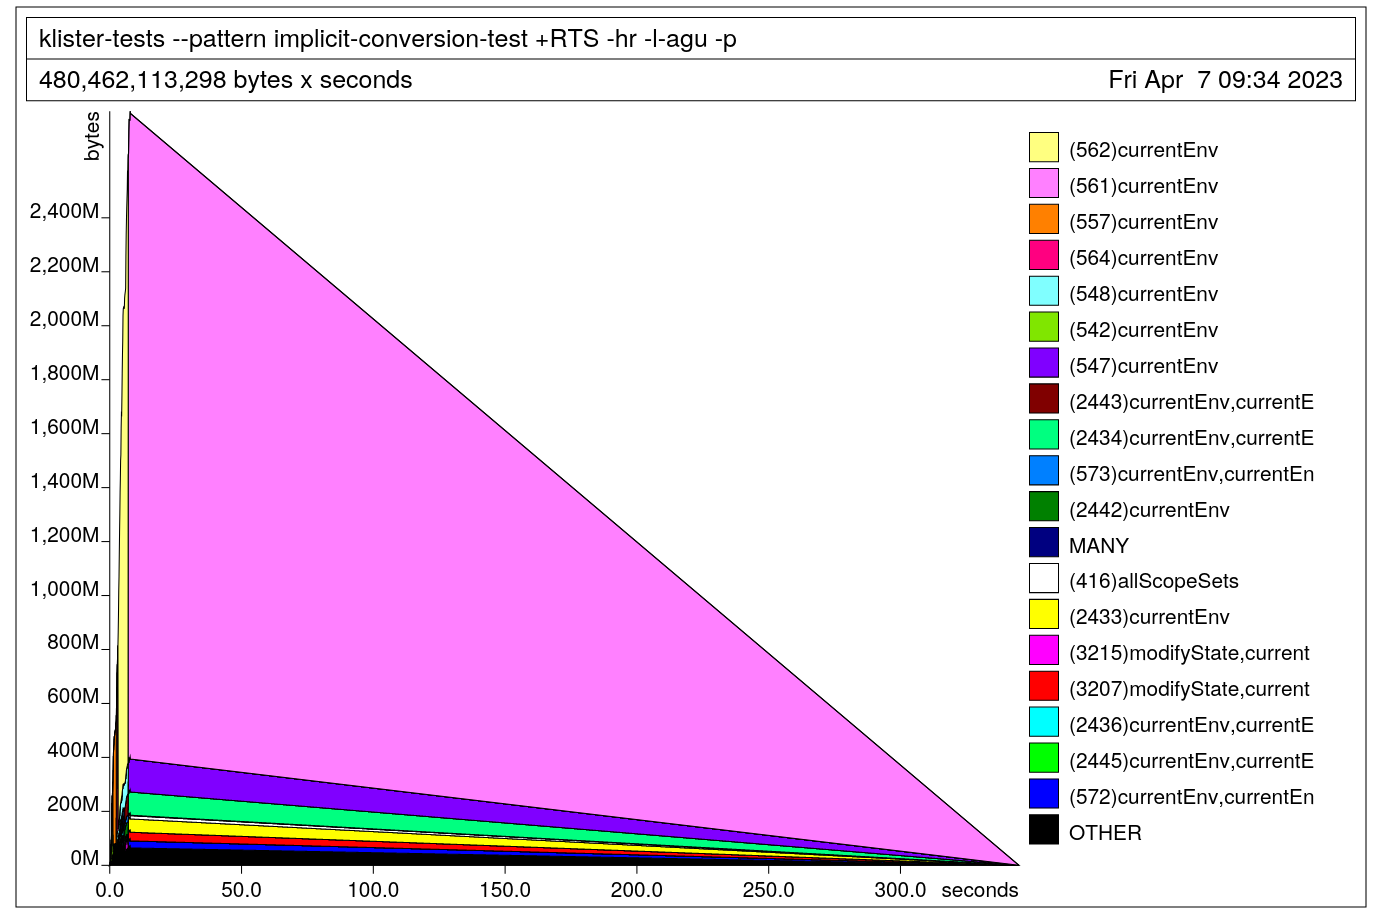
$ cabal test --test-show-details=streaming --test-options='--pattern "implicit-conversion-test" +RTS -hy -l-agu -p -RTS' --ghc-options='-eventlog -rtsopts -O2'
which produces:
We see that the heap is growing to over 2.8Gb of lists for just one test!
Crucially the shape of this profile is not indicative of a memory leak. A
typical memory leak should look like a pyramid because the program builds up
thunks and then forces them all in relatively short time. What we observe in
this profile is allocations of lists that never decrease. Now that we know the
type to look for, we can correlate this type to a subsystem in the interpreter.
To do so we’ll run another heap profile, but break down the heap by module (by
using -hm instead of -hy):
$ cabal test --test-show-details=streaming --test-options='--pattern "implicit-conversion-test" +RTS -hm -l-agu -p -RTS' --ghc-options='-eventlog -rtsopts -O2'
We see that these lists are coming from Expander.Monad. This is suspicious.
We have data being consistently allocated in essentially the state type of a
subsystem. That certainly sounds like a memory leak. Before we can conclude that
the expander has a memory leak we need to know why this data is retained at all.
This is a good scenario to use Biographical Profiling because we want to know: (1) the state
of these objects on the heap and (2) why they are not being collected, that is,
why is GHC’s runtime system keeping them alive. For (1) we’ll do a biographical
profile and for (2) a retainer profile.
Here’s the biographical profile:
$ cabal test --test-show-details=streaming --test-options='--pattern "implicit-conversion-test" +RTS -hb -l-agu -p -RTS' --ghc-options='-eventlog -rtsopts -O2'
Void! The lists are in a void state meaning these objects are allocated but
are never used (see the user guide). Now we can restate the problem: There
is a memory leak in the Expander. When implicit-conversion-test is run,
the expander allocates a total of 121.8 Gb. (eventlog shows 116171.68
MebiBytes in the detailed tab).
Now to answer why this data is being retained. Here is the retainer profile.
$ cabal test --enable-profiling --test-show-details=streaming --test-options='--pattern "implicit-conversion-test" +RTS -hr -l-agu -p -RTS' --ghc-options='-eventlog -rtsopts -O2'
$ hp2ps -c klister-tests.hp && ps2pdf klister-tests.ps
Note
Eventlog threw an exception for this retainer profile. So I’ve resorted to
use the classic tools: hp2ps and ps2pdf to render the profile.
The retainer profile clearly shows that currentEnv is keeping this data
alive and has the distinguishing profile of a memory leak. Let’s look at that
function:
-- in Expander.Monad

currentEnv :: Expand VEnv
currentEnv = do
  phase <- currentPhase
  globalEnv <- fromMaybe mempty . view (expanderWorld . worldEnvironments . at phase) <$> getState
  localEnv  <- fromMaybe mempty . view (expanderCurrentEnvs . at phase) <$> getState
  return $ globalEnv <> localEnv
This code is reading from the Expander state twice to retrieve globalEnv
and localEnv, and then returning the union of these two environments. Notice
that if the results of currentEnv are not immediately forced, then the
projections and the return will be lazy. Thus, this code will allocate a thunk
for phase, globalEnv, localEnv and the merge of both globalEnv
and localEnv. In general, unless the result of a monadic action needs to
be consumed lazily there is little reason to not make it strict in the return.
In this case, there are two call sites to currentEnv both in the expander:
-- Expander.hs
runTask :: (TaskID, ExpanderLocal, ExpanderTask) -> Expand ()
runTask (tid, localData, task) = withLocal localData $ do
...
 AwaitingDefn x n b defn t dest stx ->
   Env.lookupVal x <$> currentEnv >>=
   \case


evalDecl :: CompleteDecl -> WriterT [EvalResult] Expand ()
evalDecl (CompleteDecl d) =
  case d of
  ...
  Example loc sch expr -> do
   env <- lift currentEnv
   value <- lift $ expandEval (eval expr)
   tell $ [ExampleResult loc env expr sch value]
The first call site in runTask is immediately scrutinized by the \case
and Env.lookupVal. However, the second is not: ExampleResult is not
strict in any fields:
data EvalResult
  = ExampleResult SrcLoc VEnv Core (Scheme Ty) Value
  | IOResult (IO ())
and the whole computation is performed in a lazy WriterT monad transformer.
Before changing the code, let’s first inspect the type of the Expand monad.
Here is the definition for Expand:
newtype Expand a = Expand
  { runExpand :: ReaderT ExpanderContext (ExceptT ExpansionErr IO) a
  }
  deriving (Functor, Applicative, Monad, MonadError ExpansionErr, MonadIO, MonadReader ExpanderContext)

data ExpanderContext = ExpanderContext
  { _expanderLocal :: !ExpanderLocal
  , _expanderState :: IORef ExpanderState
  }
Where ExpanderState was shown above. So we have a classic ReaderT over IO pattern.
Meaning that the laziness of any state updates depend on the strictness of
functions operating on ExpanderContext. Next let’s check the types of
globalEnv and localEnv:
-- in Expander.Monad.hs
type VEnv = Env Var Value

-- in Env.hs
newtype Env v a = Env (IntMap (Ident, a))
  deriving newtype (Eq, Monoid, Semigroup, Show)
  deriving stock Functor

-- in World.hs

data World a = World
  { _worldEnvironments :: !(Store Phase (Env Var a))
  , _worldTypeContexts :: !(TypeContext Var SchemePtr)
  , _worldTransformerEnvironments :: !(Store Phase (Env MacroVar a))
  , _worldModules      :: !(HashMap ModuleName CompleteModule)
  , _worldVisited      :: !(HashMap ModuleName (Set Phase))
  , _worldExports      :: !(HashMap ModuleName Exports)
  , _worldEvaluated    :: !(HashMap ModuleName [EvalResult])
  , _worldDatatypes    :: !(Store Phase (HashMap Datatype DatatypeInfo))
  , _worldConstructors :: !(Store Phase (HashMap Constructor (ConstructorInfo Ty)))
  , _worldLocation     :: FilePath
  }
currentEnv returns a Expand VEnv, VEnv is a Env Var Value where
an Env is an IntMap. Thus globalEnv and localEnv are both a
strict IntMap that stores a tuple of (Ident, Value). Here is the type of
Value:
-- in Value.hs
data Value
  = ValueClosure Closure
  | ValueSyntax Syntax
  | ValueMacroAction MacroAction
  | ValueIOAction (IO Value)
  | ValueOutputPort Handle
  | ValueInteger Integer
  | ValueCtor Constructor [Value]
  | ValueType Ty
  | ValueString Text
Notice that ValueCtor holds a lazy list of Value. Should
implicit-tests create many ValueCtor then the expander state will leak
memory in Value. This leak will occur even though the IntMap is strict.
The strict IntMap well only evaluate elements to WHNF, which will be
(,), thus because Value is stored in a lazy tuple, the fields of the
tuple will be lazy unless they are carefully forced before insertion.
Let’s test this and make Value strict and then generate another
biographical profile to observe the change:
-- in Value.hs
data Value
  = ValueClosure !Closure
  | ValueSyntax  !Syntax
  | ValueMacroAction !MacroAction
  | ValueIOAction   !(IO Value)
  | ValueOutputPort !Handle
  | ValueInteger    !Integer
  | ValueCtor    !Constructor ![Value]
  | ValueType    !Ty
  | ValueString  !Text
Unfortunately, the change made no difference. We’ll revert the change and try making the monadic action strict in its return:
-- in Expander.Monad

currentEnv :: Expand VEnv
currentEnv = do
  phase <- currentPhase
  globalEnv <- fromMaybe mempty . view (expanderWorld . worldEnvironments . at phase) <$> getState
  localEnv  <- fromMaybe mempty . view (expanderCurrentEnvs . at phase) <$> getState
  return $! globalEnv <> localEnv
Notice the strict application: $!. This change results in this profile:
$ cabal test --test-show-details=streaming --test-options='--pattern "implicit-conversion-test" +RTS -hb -l-agu -p -RTS' --ghc-options='-eventlog -rtsopts -O2'
A significant improvement! Instead of 121.8 Gb the profile shows total
allocation of void of 4.62 Gb (4404.22 MiB in the detailed tab) which is a
30x reduction.
4.3.7. Optimization 3: Choosing Better Data Structures: Lists
We closed a major memory leak, and have made the implementation of the expander
more efficient, but there is yet more low hanging fruit. Consider this
definition of the BindingTable:
newtype BindingTable = BindingTable { _bindings :: HashMap Text [(ScopeSet, Binding, BindingInfo SrcLoc)] }
  deriving (Data, Show)
The BindingTable is a HashMap keyed on Text that holds a list of
3-tuples. Let’s observe how this list is used in the system:
visibleBindings :: Expand BindingTable
visibleBindings = do
  globals <- view expanderGlobalBindingTable <$> getState
  locals <- view expanderCurrentBindingTable <$> getState
  return (globals <> locals)
This visibleBindings function projects two BindingTable’s from the
ExpanderState and then merges them. This function is then called by
resolve:
resolve :: Ident -> Expand Binding
resolve stx@(Stx scs srcLoc x) = do
  p <- currentPhase
  bs <- allMatchingBindings x scs
  case bs of
    [] ->
      throwError (Unknown (Stx scs srcLoc x))
    candidates ->
      let best = maximumOn (ScopeSet.size p . fst) candidates
      in checkUnambiguous (fst best) (map fst candidates) stx *>
         return (snd best)
In resolve the BindingTable is checked to be empty, if its not empty
then the table is traversed for the maximum by scopeset. Then the maximum
element and the rest of the scopesets are passed to checkUnambiguous:
checkUnambiguous :: ScopeSet -> [ScopeSet] -> Ident -> Expand ()
checkUnambiguous best candidates blame =
  do p <- currentPhase
     let bestSize = ScopeSet.size p best
     let candidateSizes = map (ScopeSet.size p) (nub candidates)
     if length (filter (== bestSize) candidateSizes) > 1
       then throwError (Ambiguous p blame candidates)
       else return ()
In checkUnambiguous the candidates list is pruned of any duplicates,
filtered, and its length is calculated to determine an error state.
Finally, in the visit the BindingTable (bs) is projected from the
module being visited and then merged with the interpreter’s binding table:
visit :: ModuleName -> Expand Exports
visit modName = do
...
    let bs = getModuleBindings m''
    modifyState $ over expanderGlobalBindingTable $ (<> bs)
  return (shift i es)
  where getModuleBindings (Expanded _ bs) = bs
        getModuleBindings (KernelModule _) = mempty
So from this code, the BindingTable data structure undergoes merges,
traversals such as fmap and filter and the length is calculated. We can
check how often these functions are used in the prof report we generated
with the last heap profile (using the -p RTS flag). visibleBindings and
resolve are entered more than 100,000 times, checkUnambiguous is entered
less than 20,000 times. Thus merging and sorting are more important than
duplicate element removal and calculating length. Based on this usage, we’ll
replace the list with a Data.Sequence, a Data.Set would also work and
would provide uniqueness by default, but Data.Set has slower merge behavior
compared to a Data.Sequence for many elements
(\(\mathcal{O}(\log{(\min(n_{1},n_{2}))})\), compared to
\(\mathcal{O}(m \log{\frac{n + 1}{m + 1}})\), where \(m \le n\)).
BindingTable is not the only suspicious list. Consider this list in the
definition of Module:
data Module f a = Module
  { _moduleName :: ModuleName
  , _moduleImports :: !Imports
  , _moduleBody :: f a
  , _moduleExports :: !Exports
  }
  deriving (Data, Functor, Show)

 data CompleteModule
  = Expanded !(Module [] CompleteDecl) !BindingTable
  | KernelModule !Phase
  deriving (Data, Show)
This list is passed to Module as a type argument. But is used in this code
in the expander monad:
getDeclGroup :: DeclTreePtr -> Expand [CompleteDecl]
getDeclGroup ptr =
  (view (expanderCompletedDeclTrees . at ptr) <$> getState) >>=
  \case
    Nothing -> throwError $ InternalError "Incomplete module after expansion"
    Just DeclTreeLeaf -> pure []
    Just (DeclTreeAtom decl) ->
      (:[]) <$> getDecl decl
    Just (DeclTreeBranch l r) ->
      (++) <$> getDeclGroup l <*> getDeclGroup r
Notice that the DeclTreeBranch l r case will be expensive because it will
merge every combination of elements in the l and r groups with list
concatenation. Just this line is enough to change the data structure to a
sequence, again because a sequence has fast merging and cons behavior [3].
4.3.8. Optimization 4: Fixing allScopeSets
We,ve come quite far, but there is still a lot of void in the heap profile.
This is a good scenario for info-table profiling. Info-table profiling relates
source code to closures so we can see the exact line of source code the void
is originating.
$ cabal test --test-show-details=streaming --test-options='--pattern "implicit-conversion-test" +RTS -hi -i0.05 -l -RTS' --ghc-options='-eventlog -rtsopts -O2 -finfo-table-map -fdistinct-constructor-tables'
and the profile is rendered in eventlog:
Notice that the legend displays the Info Table Address instead of the
closure type, module, or biography. From the profile we find that 0x7c41d0
and 0xc0c330 are responsible for the void allocation. The detailed tab
maps these addresses directly to source code. In the detailed tab, we see that
0x7c41d0 has the description sat_sN17_info, the closure type THUNK,
the type f a, and is in the module ScopeSet at line 146. That line is
exactly the local combine function in allScopeSets. Recall that we also
observed allScopeSets doing the most allocation in addition to having a high
degree of entries in the ticky profile above. It therefore seems crucial to
optimize the function. Here is the source code:
allScopeSets :: Data d => Traversal' d ScopeSet
allScopeSets = allScopeSets'
  where
    allScopeSets' :: forall f d. (Applicative f, Data d)
                  => (ScopeSet -> f ScopeSet)
                  -> d -> f d
    allScopeSets' f = gmapA go
      where
        go :: forall a. Data a => a -> f a
        go a = case eqT @a @ScopeSet of
          Just Refl -> f a
          Nothing -> allScopeSets' f a

    -- A variant of Data.Data.gmapM which uses Applicative instead of Monad
    gmapA :: forall f d. (Applicative f, Data d)
          => (forall x. Data x => x -> f x)
          -> d -> f d
    gmapA g = gfoldl combine pure
      where
        combine :: Data a => f (a -> b) -> a -> f b
        combine ff a = (<*>) ff (g a)
This code is exceedingly polymorphic and is effectively asking GHC to generate
traversals over many different data types. From the info-table profiling we know
that combine is building up thunks of function applications. In the body of
combine there are two function application sites: g a and (<*>) ff (g
a). To determine which is responsible we’ll force each and rerun the
info-table profiling, beginning with <*> ff (g a):
combine :: Data a => f (a -> b) -> a -> f b
combine ff a = let !res = (<*>) ff (g a) in res
Unfortunately, this produces the same profile. Let’s next force g a:
combine :: Data a => f (a -> b) -> a -> f b
combine ff a = let !ga = (g a) in (<*>) ff ga
and rerun the test:
$ cabal test --test-show-details=streaming --enable-profiling --test-options='--pattern "implicit-conversion-test" +RTS -hi -i0.05 -l -rticky -RTS' --ghc-options='-eventlog -rtsopts -ticky -O2 -finfo-table-map -fdistinct-constructor-tables'
  ...
  Running 1 test suites...
  Test suite klister-tests: RUNNING...
  All tests
    Golden tests
      implicit-conversion-test: OK (1919.27s)

  All 1 tests passed (1919.29s)
  Test suite klister-tests: PASS
The test finished in 1919.27 seconds; clearly forcing this thunk produced a regression. The heap profile similarly shows much more memory allocation:
Now this test allocates around 2.6Gb, unfortunately the info-table profiling
does not display the information for the most allocating info table address
0x1b93550. We’ll do one last test and make both the entire body and g a
strict:
combine :: Data a => f (a -> b) -> a -> f b
combine ff a = let !ga = (g a)
                   !res = (<*>) ff ga
                   in res
Running 1 test suites...
Test suite klister-tests: RUNNING...
All tests
  Golden tests
    implicit-conversion-test: OK (1906.82s)

All 1 tests passed (1906.84s)
Test suite klister-tests: PASS
Not much better. We saw that combine was building up thunks with info-table
profiling, but by forcing those thunks the heap grew from 100Mb to 2.6Gb. So
even though info-table profiling pointed to allScopeSets, our problem lies
elsewhere. If allScopeSets was the culprit then we would expect an
improvement, which was not observed. But we have learned that allScopeSets
is on the critical path of the memory leak. We’ll leave these changes in place
to determine what type of closures are newly leaking:
Note
This is a common phenomena when plugging memory leaks. By adding strictness to the critical path the leak is on, it is often the case that the laziness moves to another part of system until the root cause is discovered. So by leaving these changes in place we are traversing the critical path that leads to the leak.
$ cabal test --enable-profiling --test-show-details=streaming --test-options='--pattern "implicit-conversion-test" +RTS -hy -l-agu -p -L50 -RTS' --ghc-options='-eventlog -rtsopts -O2'
which yields:
Almost all the memory allocated on the heap is a list [] of some type. Let’s
inspect the code path for allScopeSets, normally one would do a retainer
analysis to find the right code path, but in this case allScopeSets is only
called in one function: visit:
visit :: ModuleName -> Expand Exports
visit modName = do
  (m, es) <-
    do world <- view expanderWorld <$> getState
       case view (worldModules . at modName) world of
         Just m -> do
           let es = fromMaybe noExports $ view (worldExports . at modName) world
           return (m, es)
         Nothing ->
           inPhase runtime $
             loadModuleFile modName
  p <- currentPhase
  let i = phaseNum p
  visitedp <- Set.member p .
              view (expanderWorld . worldVisited . at modName . non Set.empty) <$>
              getState
  unless visitedp $ do
    let m' = shift i m -- Shift the syntax literals in the module source code
    sc <- freshScope $ T.pack $ "For module-phase " ++ shortShow modName ++ "-" ++ shortShow p
    let m'' = over ScopeSet.allScopeSets (ScopeSet.insertUniversally sc) m'
    evalResults <- inPhase p $ evalMod m''
    modifyState $
      set (expanderWorld . worldEvaluated . at modName)
          (Just evalResults)
    let bs = getModuleBindings m''
    modifyState $ over expanderGlobalBindingTable $ (<> bs)
  return (shift i es)
  where getModuleBindings (Expanded _ bs) = bs
        getModuleBindings (KernelModule _) = mempty
We see that allScopeSets is only used to construct m'', by traversing
the data in m', and applying the function ScopeSet.insertUniversally
with the argument sc. Here is insertUniversally:
insertUniversally :: Scope -> ScopeSet -> ScopeSet
insertUniversally sc = set (universalScopes . at sc) (Just ())
and recall that a Scope is:
data Scope = Scope { scopeNum :: Int, scopePurpose :: Text }
  deriving (Data, Eq, Ord, Show)
which is created in freshScope:
freshScope :: Text -> Expand Scope
freshScope why = do
  n <- view expanderNextScopeNum <$> getState
  modifyState $ over expanderNextScopeNum $ (+ 1)
  return (Scope n why)
The Scope type is overly lazy and is inefficient. The Int is incremented
lazily in freshScope, the Text is constructed lazily and is only used
for debugging in an error state [4]. Furthermore, notice that the Eq and
Ord instances are derived, which means the Text field is unnecessarily
scrutinized to insert and balance the Set even though the ordinal
information on the Text field is not useful to the interpreter. This is
especially problematic given the high entry counts we observed for
isSubsetOf and allScopeSets.
To fix the Scope type we’ll make the Int field strict, remove the
Text field entirely and inline freshScope . The Int field should be
strict to ensure the increments do not accumulate thunks and to make sure GHC
will unpack the Int. We could choose to make the Text field strict, but
this would be a mistake because the Text field is only used in an error
state, so making it strict would mean allocating memory in a hot loop when it is
unnecessary to do so. Furthermore, removing the Text field unlocks better
data structures; with its removal we can use a newtype instead of a data
type, thereby reducing allocations, and use an IntSet instead of a Set.
An IntSet is similar to an IntMap (it is also implemented as a
big-endian PATRICIA trie) but the implementation in containers is tuned for
dense sets (where the elements are close in value), which is the kind of
IntSet the klister interpreter generates.
The Text field is allocated in this line:
...
    sc <- freshScope $ T.pack $ "For module-phase " ++ shortShow modName ++ "-" ++ shortShow p
...
We’ll test that this is the source of the [] (due to the String) by
forcing the Text object, and then rerun a closure type heap profile to
observe any changes:
...
    sc <- freshScope $! T.pack $ "For module-phase " ++ shortShow modName ++ "-" ++ shortShow p
...
Notice, the strict application: $!, after freshScope. Here is the heap
profile:
Much better, the interpreter is still leaking [] but the heap stays under
50Mb. We have found the memory leak. Now we’ll go further and remove the
Text field from Scope and change ScopeSet to use IntSet. To
preserve the ability to debug we’ll use a CPP pragma that includes the Text
field for a debug build and elides it for a normal build. Here are the final
definitions:
-- Util.Set is an IntSet with more type information
newtype Set key = Set { unSet :: IntSet }
  deriving newtype (Eq, Ord, Show, Semigroup, Monoid)
  deriving stock   Data
type role Set representational

-- In Scope.hs
#ifndef KDEBUG
newtype Scope = Scope { scopeNum :: Int}
  deriving newtype (Eq, Ord, Show, HasKey)
  deriving stock Data
#else
-- For a debug build Scope keeps a blob of text for debugging the expander
-- output. This will have an impact of the performance of the interpreter so it
-- won't be useful for performance issues
data Scope = Scope { scopeNum :: Int, scopePurpose :: Text }
  deriving (Data, Eq, Ord, Show)
#endif

#ifndef KDEBUG
freshScope :: Text -> Expand Scope
{-# INLINE freshScope #-}
freshScope _why = do
  n <- view expanderNextScopeNum <$> getState
  modifyState $ over expanderNextScopeNum (+ 1)
  return (Scope n)
#else
freshScope :: Text -> Expand Scope
{-# INLINE freshScope #-}
freshScope why = do
  n <- view expanderNextScopeNum <$> getState
  modifyState $ over expanderNextScopeNum (+ 1)
  return (Scope n why)
#endif
Notice that the API to freshScope does not change. In total, there are 11
more call sites to freshScope throughout the interpreter that are leaking.
So if we had changed the API then the CPP would proliferate even more. To avoid
the extra CPP we inline freshScope; this will ensure that in a non-debug
build GHC will determine that the Text argument is dead and remove it,
thereby clearing the memory leaks at each call site.
Now we’ll revert the strictness changes in allScopeSets and check the
runtime of implicit-conversion-test to observe the effect of our
optimizations:
$ cabal test --test-show-details=streaming --test-options='--pattern "implicit-conversion-test"' --ghc-options='-O2'
  ...
  Test suite klister-tests: RUNNING...
  All tests
    Golden tests
      implicit-conversion-test: OK (1.10s)

  All 1 tests passed (1.11s)
  Test suite klister-tests: PASS
Much better, implicit-conversion-test is about nine times faster. Let’s
rerun the entire test suite to check the progress we’ve made. Recall that the
testsuite originally took 38 seconds to finish.
$ cabal test --test-show-details=streaming --ghc-options='-O2'
  ...
  Test suite klister-tests: RUNNING...
  All tests
      Module tests
        Expected to succeed
          ...
          examples/lang.kl:                              OK (0.03s)
          examples/import.kl:                            OK (0.03s)
          examples/macro-body-shift.kl:                  OK (0.03s)
          examples/test-quasiquote.kl:                   OK (0.03s)
          examples/quasiquote-syntax-test.kl:            OK (0.03s)
          examples/hygiene.kl:                           OK (0.27s)
          examples/defun-test.kl:                        OK (0.02s)
          examples/fun-exports-test.kl:                  OK (0.03s)
    Golden tests
      test-quasiquote:                                   OK (0.03s)
      io:                                                OK (0.03s)
      defun-test:                                        OK (0.02s)
      contract:                                          OK (0.08s)
      int-ops:                                           OK (0.03s)
      implicit-conversion:                               OK (0.99s)
      implicit-conversion-test:                          OK (1.11s)
      higher-kinded-patterns:                            OK (0.39s)
      custom-literals-test:                              OK (0.20s)
      double-define:                                     OK (0.18s)
      custom-module-test:                                OK (0.22s)
      which-problem:                                     OK (0.24s)
      incorrect-context:                                 OK (0.02s)
      bound-vs-free:                                     OK (0.13s)
      meta-macro:                                        OK (0.08s)
      integer-syntax:                                    OK (0.03s)
      import:                                            OK (0.03s)

  All 124 tests passed (9.89s)
  Test suite klister-tests: PASS
The entire test suite finished in just under 10 seconds, or about as fast as
implicit-conversion-test finished originally. implicit-conversion-test
is also not the only test that benefited. Almost every test is faster; for
example, which-problem finishes in 240 ms compared to 820 ms,
double-define finishes in 180 ms compared to 340 ms. Our work here is done
for now.
4.3.9. Summing up
Our goal was to speed up the klister interpreter. To do so we found a poor performing test and focused on the macro expander subsystem of the interpreter. Then we employed a number of methods to find performance problems. We used:
Ticky Profiling: To determine hot loops and highly allocating functions
Biographical/Retainer Profiling: To determine the source of memory leaks in the expander state. This technique led our analysis to the lazy return in
currentEnv.Info-Table Profiling: To determine the line of code closures on the heap came from. This technique led our analysis to the
visitfunction and ultimately to the leakyTextfieldScope.
Key to our analysis was a careful debugging process. We:
Found a reproducible test case.
Didn’t guess, instead we looked: We used GHC’s instrumentation to develop hypotheses about the klister interpreter’s performance instead of guessing and performing shotgun debugging.
Only changed one thing at a time: We tried to only change a single function, or a single type at a time. Then, if we did not observe any difference with the instrumentation we reverted the change.
Could we have gone farther? Of course. The interpreter is still leaking []
even though the heap stays under 50Mb. In the end, the optimizations were
trivial; we only chose better data structures and closed memory leaks. We could
still optimize or memoize isSubsetOf, unroll the Expander monad
transformer, fix the expander’s use of the WriterT monad transformer; which
is well known to leak memory [5], do some manual loop fusion, or oneShot the expander monad. But for a first pass our results
are good enough.